OpenTelemetry 介绍
OpenTelemetry 是一个可观测性框架和工具包,旨在创建和管理遥测数据,如
链路(traces)、指标(metrics)和日志(logs)。
介绍
-
OpenTelemetry是一个 CNCF 孵化级项目- 于 2019 年 5 月 7 日被 CNCF 接收,并于 2021 年 8 月 26 日转入孵化成熟度级别
- 该项目由
OpenTracing和OpenCensus项目合并而诞生的 - 100% 免费和开源的
-
OpenTelemetry专注于遥测数据的生成、采集、管理和导出 -
OpenTelemetry是各类 API、SDK 和工具形成的集合- 可用于插桩、生成、采集和导出遥测数据(链路、指标和日志),帮助分析软件的性能和行为
- 开发语言支持 C++、.NET、Erlang / Elixir、Go、Java、JavaScript / TypeScript、PHP、Python、Ruby、Rust、Swift 等
-
OpenTelemetry 的一个主要目标是,无论应用程序或系统采用何种编程语言、基础设施或运行时环境,都可以轻松地将其仪表化。重要的是,遥测数据的存储和可视化是有意留给
其他工具处理的- OpenTelemetry 是供应商和工具无关的,这意味着它可以与各种可观测性后端一起使用,包括 Jaeger 和 Prometheus 等开源工具以及商业化产品
-
OpenTelemetry 可扩展性强
什么是可观测性
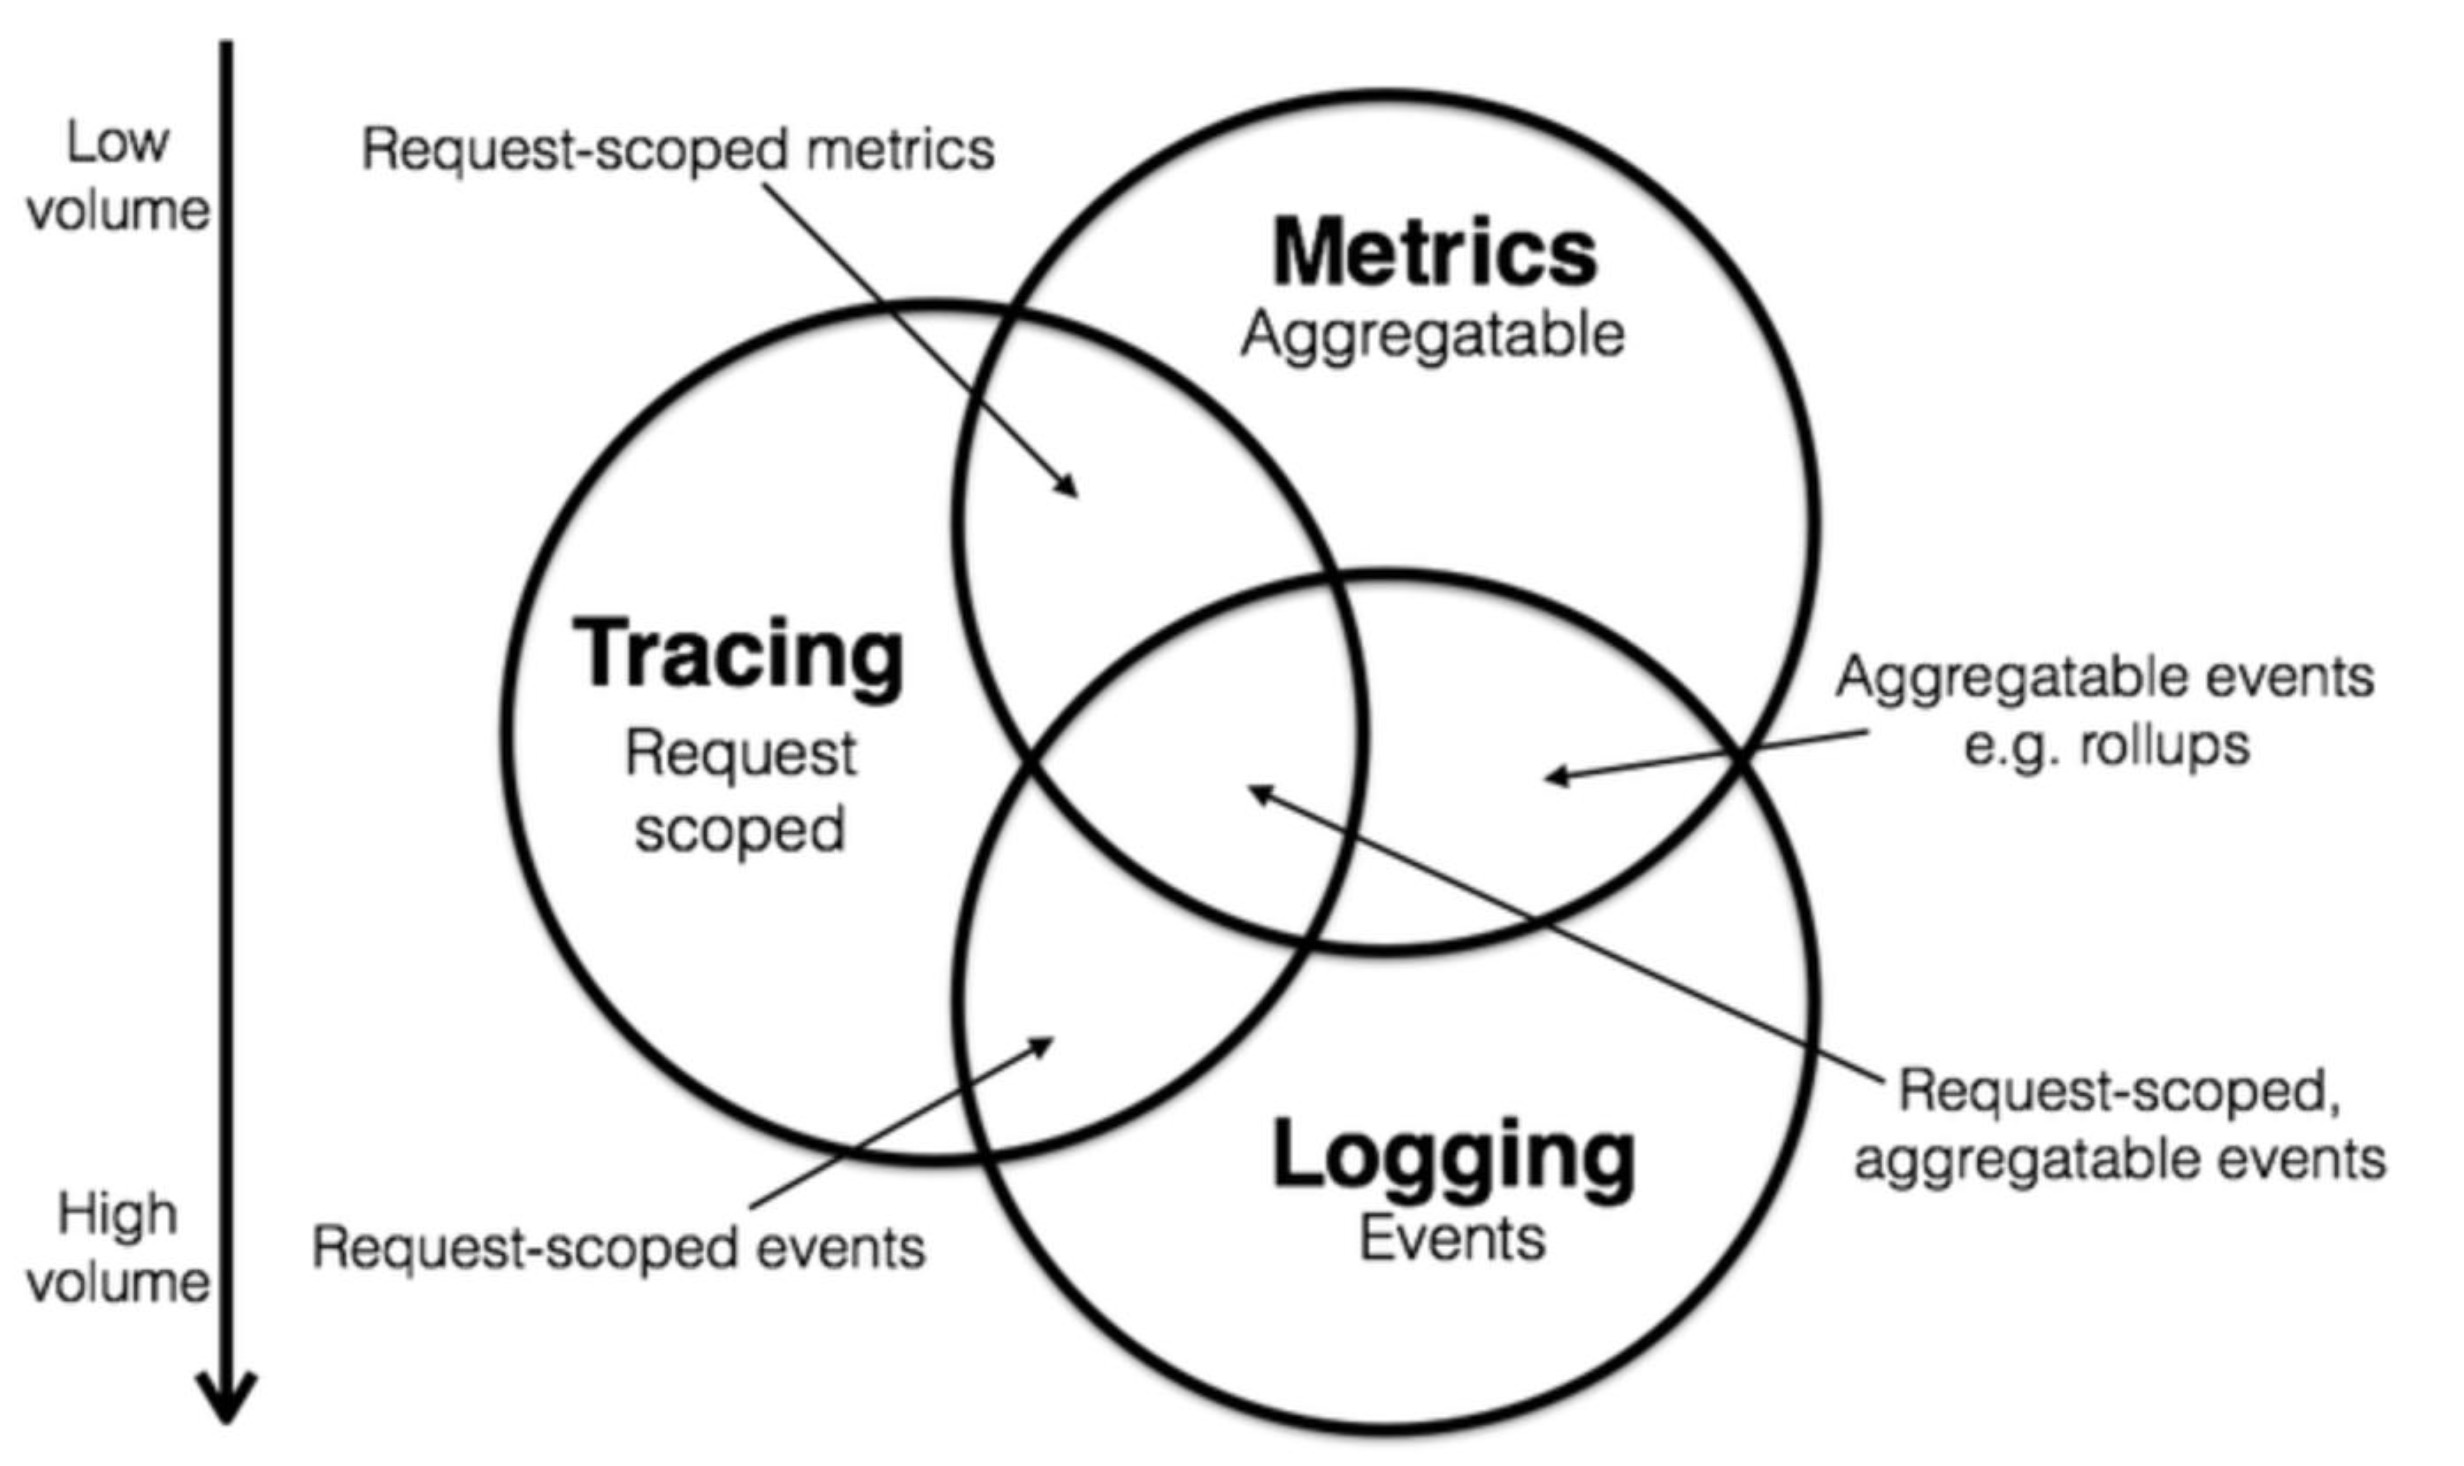
- 论文 Dapper, a Large-Scale Distributed Systems Tracing Infrastructure 提出
链路(traces)、指标(metrics)和日志(logs)三大方向互为补充的可观测解决方案- 基于 eBPF 的
Profiling(剖析数据)作为补充
- 基于 eBPF 的
- 可观测性具备检查系统输出来理解系统内部状态的能力。在软件的上下文中,这意味着通过检查遥测数据(包括链路、指标和日志)来理解系统的内部状态
- 要使系统可观测,必须对其进行仪表化(可视化)
- OpenTelemetry 包括可观测性的三个支柱
分布式追踪一种跟踪服务请求在分布式系统中从开始到结束的方法- 在系统进程内部、进程间通过共享进程的 Context 上下文对象传递链路信息
- 如
Http Headers可以起到传递Context载体作用,分布式追踪中称为Propagators
指标对一段时间内活动的测量,反应系统或应用程序的性能日志系统或应用程序在特定时间点发生的事件的文本记录
OpenTelemetry 组件
- 适用于所有组件的规范
- 定义遥测数据形状的标准协议
- 为常见遥测数据类型定义标准命名方案的语义约定
- 定义如何生成遥测数据的 API
- 实现规范、API 和遥测数据导出的语言 SDK
- 实现常见库和框架的仪表化的库生态系统
- 可自动生成遥测数据的自动仪表化组件,无需更改代码
- OpenTelemetry Collector:接收、处理和导出遥测数据的代理
- 各种其他工具, 如用于 Kubernetes 的 OpenTelemetry Operator、OpenTelemetry Helm Charts 和 FaaS 的社区资产
扩展
- 统一数据采集
- 数据类型:指标、链路、日志
- 采集方式:拉、推方式
- 数据源
- OTEL SD/API
- Prometheus Exporter
- 应用、网关日志
- 中间件等
核心概念
Observability primer(核心可观测性概念)- Logs
Spans代表一个工作(work)或操作(operation)单元。Spans用来跟踪请求的特定操作,描绘出在执行该操作期间发生的情况span由name,time-related data,structured log messages, andother metadata(that is, Attributes)更多请参考
Context Propagation(上下文传播)常见的传播器(Propagator)包括- Trace Context:用于在
HTTP headers中编码trace数据,以便在不同的服务间传递这些数据 Baggage用于在span之间传递键值对数据,例如用户 ID、请求 ID 等B3用于在 HTTP headers 中编码 trace 数据,以便在不同的服务间传递这些数据(主要用于 Zipkin 或其兼容的系统)
- Trace Context:用于在
SignalsOpenTelemetry 支持的遥测类别Traces请求在应用程序的过程,记录应用程序请求时发生的细节Tracer Provider是Tracers的工厂类,一般初始化一次,其生命周期与应用程序的生命周期一致,初始化还包括资源和导出程序的初始化Tracer跟踪器,通过创建 Spans 包含关于特定操作(如服务中的请求)的更多信息Trace Exporters向消费者发送跟踪信息Context Propagation是实现分布式跟踪的核心概念。通过Context Propagation(上下文传播)功能,无论Spans是在哪里生成的,都可以将Spans相互关联起来,并组合成一个TraceSpans是Traces的组成部分,包括如下信息:- Name
- Parent span ID (empty for root spans)
- Start and End Timestamps
- Span Context
- The Trace ID representing the trace that the span is a part of
- The span’s Span ID
- Trace Flags, a binary encoding containing information about the trace
- Trace State, a list of key-value pairs that can carry vendor-specific trace information
- Attributes
- Span Events
- Span Links
- Span Status,可能得值
- Unset
- Error
- Ok
- Span Kind(Span 类型):Client, Server, Internal, Producer, or Consumer
- Metrics 运行时捕获的测量值
- Logs 文本事件记录
- Baggage 信号之间传递的上下文信息
- Instrumentation
- .net/java/javascript 支持
零代码(Zero-code)配置
- .net/java/javascript 支持
- 构成 OpenTelemetry 的主要组件
- OpenTelemetry Collector 是一个与供应商无关的代理,可以接收、处理和导出遥测数据
- 功能
receivestraces, metrics, and logsprocessesthe telemetryexportsit to a wide variety of observability backends using its components
- 它支持以多种格式接收遥测数据(例如 OTLP、Jaeger、Prometheus 以及许多商业/专有工具)并将数据发送到一个或多个后端
- 更多参考
- 部署模式
- No Collector 直接从应用程序向后端发送信号
- Agent 模式 向收集器发送信号,再从收集器向后端发送信号
- Gateway 模式 向单个 OTLP 端点发送信号,并从那里向后端发送信号
- 功能
- APIs & SDK:OpenTelemetry SDK 允许您使用 OpenTelemetry API 以某种语言生成遥测数据并将数据导出到后端
- OpenTelemetry Collector 是一个与供应商无关的代理,可以接收、处理和导出遥测数据
- 语义约定:不同类型的操作和数据的通用名称
- Sampling
- OpenTelemetry protocol (OTLP) https://github.com/open-telemetry/opentelemetry-proto/blob/main/docs/
安装 OpenTelemetry Collector
架构

- 图片参考
Docker
extensions:
zpages:
endpoint: localhost:55679
receivers:
otlp:
protocols:
grpc:
endpoint: localhost:4317
http:
endpoint: localhost:4318
processors:
batch:
memory_limiter:
# 75% of maximum memory up to 2G
limit_mib: 1536
# 25% of limit up to 2G
spike_limit_mib: 512
check_interval: 5s
exporters:
debug:
verbosity: detailed
service:
pipelines:
traces:
receivers: [otlp]
processors: [memory_limiter, batch]
exporters: [debug]
metrics:
receivers: [otlp]
processors: [memory_limiter, batch]
exporters: [debug]
extensions: [zpages]
- start docker
docker run -v $(pwd)/config.yaml:/etc/otelcol-contrib/config.yaml otel/opentelemetry-collector-contrib:0.102.1Kubernetes
# deploys an agent as a daemonset and a single gateway instance
kubectl apply -f https://raw.githubusercontent.com/open-telemetry/opentelemetry-collector/v0.102.1/examples/k8s/otel-config.yaml

# or by helm charts
helm repo add open-telemetry https://open-telemetry.github.io/opentelemetry-helm-charts

# or by OpenTelemetry Operator
# 1. create opentelemetry-operator deployment
kubectl apply -f https://github.com/open-telemetry/opentelemetry-operator/releases/latest/download/opentelemetry-operator.yaml

# 2. create an OpenTelemetry Collector (otelcol) instance
$ kubectl apply -f - <<EOF
apiVersion: opentelemetry.io/v1alpha1
kind: OpenTelemetryCollector
metadata:
  name: simplest
spec:
  config: |
    receivers:
      otlp:
        protocols:
          grpc:
            endpoint: 0.0.0.0:4317
          http:
            endpoint: 0.0.0.0:4318
    processors:

    exporters:
      # NOTE: Prior to v0.86.0 use `logging` instead of `debug`.
      debug:

    service:
      pipelines:
        traces:
          receivers: [otlp]
          processors: []
          exporters: [debug]
EOF

# 3. creates a basic Instrumentation resource that is configured specifically for instrumenting Go services
kubectl apply -f - <<EOF
apiVersion: opentelemetry.io/v1alpha1
kind: Instrumentation
metadata:
  name: demo-instrumentation
spec:
  exporter:
    endpoint: http://demo-collector:4318
  propagators:
    - tracecontext
    - baggage
  sampler:
    type: parentbased_traceidratio
    argument: "1"
EOF

# 4. Add annotations to existing deployments, spec.template.metadata.annotations
Go: instrumentation.opentelemetry.io/inject-go: "true"
Linux
sudo apt-get update
sudo apt-get -y install wget systemctl
wget https://github.com/open-telemetry/opentelemetry-collector-releases/releases/download/v0.102.1/otelcol_0.102.1_linux_amd64.deb
sudo dpkg -i otelcol_0.102.1_linux_amd64.deb
配置
otel-config.yaml配置包括如下部分- Receivers 从一个或多个来源收集遥测数据,可基于拉式或推式,并可支持一个或多个数据源
- Processors 将接收方收集的数据进行修改或转换,然后再发送给 exporters
- 根据为每个处理器定义的规则或设置进行数据处理,其中可能包括过滤、丢弃、重命名或重新计算遥测数据等操作
- Exporters 向一个或多个后端或目的地发送数据
- 输出器可以是拉式或推式的,并可支持一个或多个数据源
- Connectors 连接两条管道,同时充当输出方和接收方
- Extensions 是可选组件,用于扩展采集器的功能,以完成与处理遥测数据不直接相关的任务
支持的 Exporters
- open-telemetry/opentelemetry-collector 支持的 exporters
- Debug
- OTLP gRPC
- OTLP HTTP
- open-telemetry/opentelemetry-collector-contrib repository 有更多的 exporters 可在其构建中使用,包括(详细参考):
- alertmanager
- alibabacloudlogservice
- awscloudwatchlogs
- awsemf
- awskinesis
- awss3
- awsxray
- azuredataexplorer
- azuremonitor
- carbon
- cassandra
- clickhouse
- coralogix
- datadog
- dataset
- elasticsearch
- file
- googlecloud
- googlecloudpubsub
- googlemanagedprometheus
- honeycombmarker
- influxdb
- instana
- kafka
- kinetica
- loadbalancing
- logicmonitor
- logzio
- loki
- mezmo
- opencensus
- opensearch
- otelarrow
- prometheus
- prometheusremotewrite
- pulsar
- rabbitmq
- sapm
- sentry
- signalfx
- skywalking
- splunkhec
- sumologic
- syslog
- tencentcloudlogservice
- zipkin
Agent 模式
- Traces 配置
receivers:
  otlp: # the OTLP receiver the app is sending traces to
    protocols:
      http:
        endpoint: 0.0.0.0:4318

processors:
  batch:

exporters:
  otlp/jaeger: # Jaeger supports OTLP directly
    endpoint: https://jaeger.example.com:4317

service:
  pipelines:
    traces/dev:
      receivers: [otlp]
      processors: [batch]
exporters: [otlp/jaeger]- Metrics 配置
receivers:
  otlp: # the OTLP receiver the app is sending metrics to
    protocols:
      http:
        endpoint: 0.0.0.0:4318

processors:
  batch:

exporters:
  prometheusremotewrite: # the PRW exporter, to ingest metrics to backend
    endpoint: https://prw.example.com/v1/api/remote_write

service:
  pipelines:
    metrics/prod:
      receivers: [otlp]
      processors: [batch]
exporters: [prometheusremotewrite]- Logs 配置
receivers:
  otlp: # the OTLP receiver the app is sending logs to
    protocols:
      http:
        endpoint: 0.0.0.0:4318

processors:
  batch:

exporters:
  file: # the File Exporter, to ingest logs to local file
    path: ./app42_example.log
    rotation:

service:
  pipelines:
    logs/dev:
      receivers: [otlp]
      processors: [batch]
      exporters: [file]
Gateway 模式
- 参考
- NGINX 配置示例
server {
    listen 4317 http2;
    server_name _;

    location / {
            grpc_pass      grpc://collector4317;
            grpc_next_upstream     error timeout invalid_header http_500;
            grpc_connect_timeout   2;
            grpc_set_header        Host            $host;
            grpc_set_header        X-Real-IP       $remote_addr;
            grpc_set_header        X-Forwarded-For $proxy_add_x_forwarded_for;
    }
}

server {
    listen 4318;
    server_name _;

    location / {
            proxy_pass      http://collector4318;
            proxy_redirect  off;
            proxy_next_upstream     error timeout invalid_header http_500;
            proxy_connect_timeout   2;
            proxy_set_header        Host            $host;
            proxy_set_header        X-Real-IP       $remote_addr;
            proxy_set_header        X-Forwarded-For $proxy_add_x_forwarded_for;
    }
}

upstream collector4317 {
    server collector1:4317;
    server collector2:4317;
}

upstream collector4318 {
    server collector1:4318;
    server collector2:4318;
}
扩展
OpenTracing
- OpenTracing 用于分布式跟踪的厂商中立 API 和仪器
- 该项目已存档(archived CNCF project),并合入 Opentelemetry 项目
- 下表参考
| Capability | OpenTracing concept | OpenTelemetry concept |
|---|---|---|
| Represent traces as directed acyclic graphs (not just trees) | span references | span links |
| Strongly typed span attributes | span tags | span attributes |
| Strongly typed events/logs | span logs | span events |
周边组件
- OPLG
- OpenTelemetry Traces:高质量的、无处不在的、便携式的遥测,以实现有效的可观测性,CNCF incubating project
OpenTelemetry Collector边缘侧数据统一处理与路由- Demo
- Prometheus Metircs
- Loki Logs
- Grafana Dashboards
- OpenTelemetry Traces:高质量的、无处不在的、便携式的遥测,以实现有效的可观测性,CNCF incubating project
- OPLG 组件核心优势
- 开源
- 标准统一
- 自由组合
- Dubbo 链路追踪基于 Micrometer 实现
- Micrometer 与 SpringBoot 3 适配的比较好, Java 优好
- Grafana Tempo 是一个开源、易用且大规模的分布式跟踪后端
- Tempo 成本效益高,只需对象存储即可运行,并与 Grafana、Prometheus 和 Loki 深度集成
- Tempo 可以摄取常见的开源跟踪协议,包括 Jaeger、Zipkin 和 OpenTelemetry
- https://github.com/grafana/tempo
- https://github.com/grafana/tempo/tree/v2.9.0/example
实现
参考
最近更新
最新评论